See what your NestJS app really does
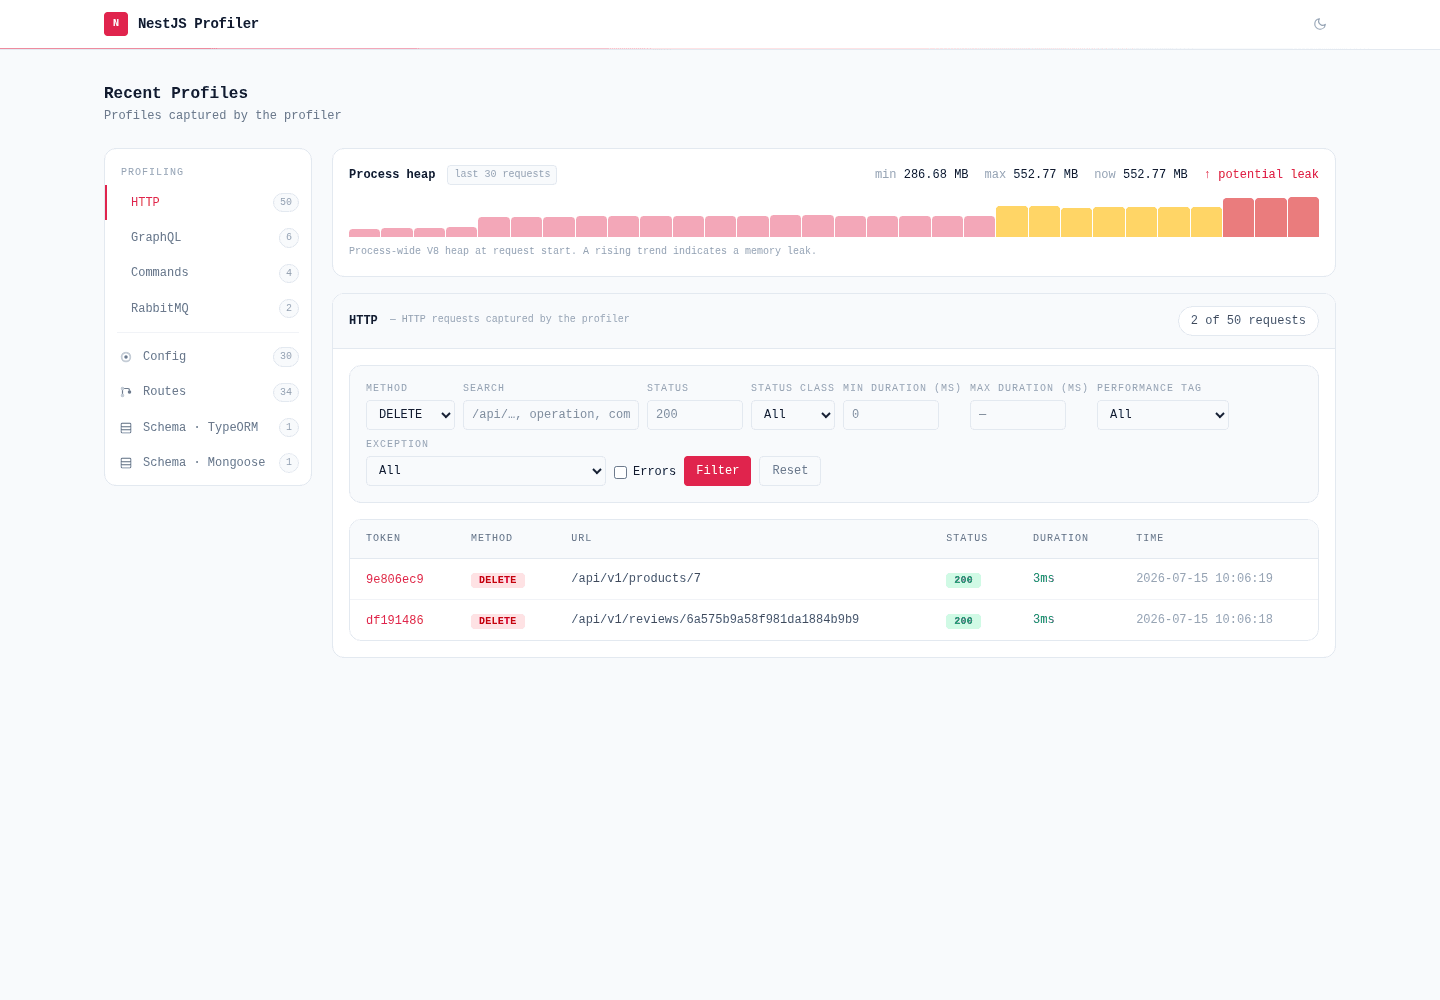
An execution profiler for NestJS with a rich panel UI at /_profiler. Inspect SQL, HTTP calls, GraphQL, cache, auth, validation and custom spans - in real time.
One panel per collector
Install the core package, then add only the collectors you need. Each is a self-contained NestJS module.
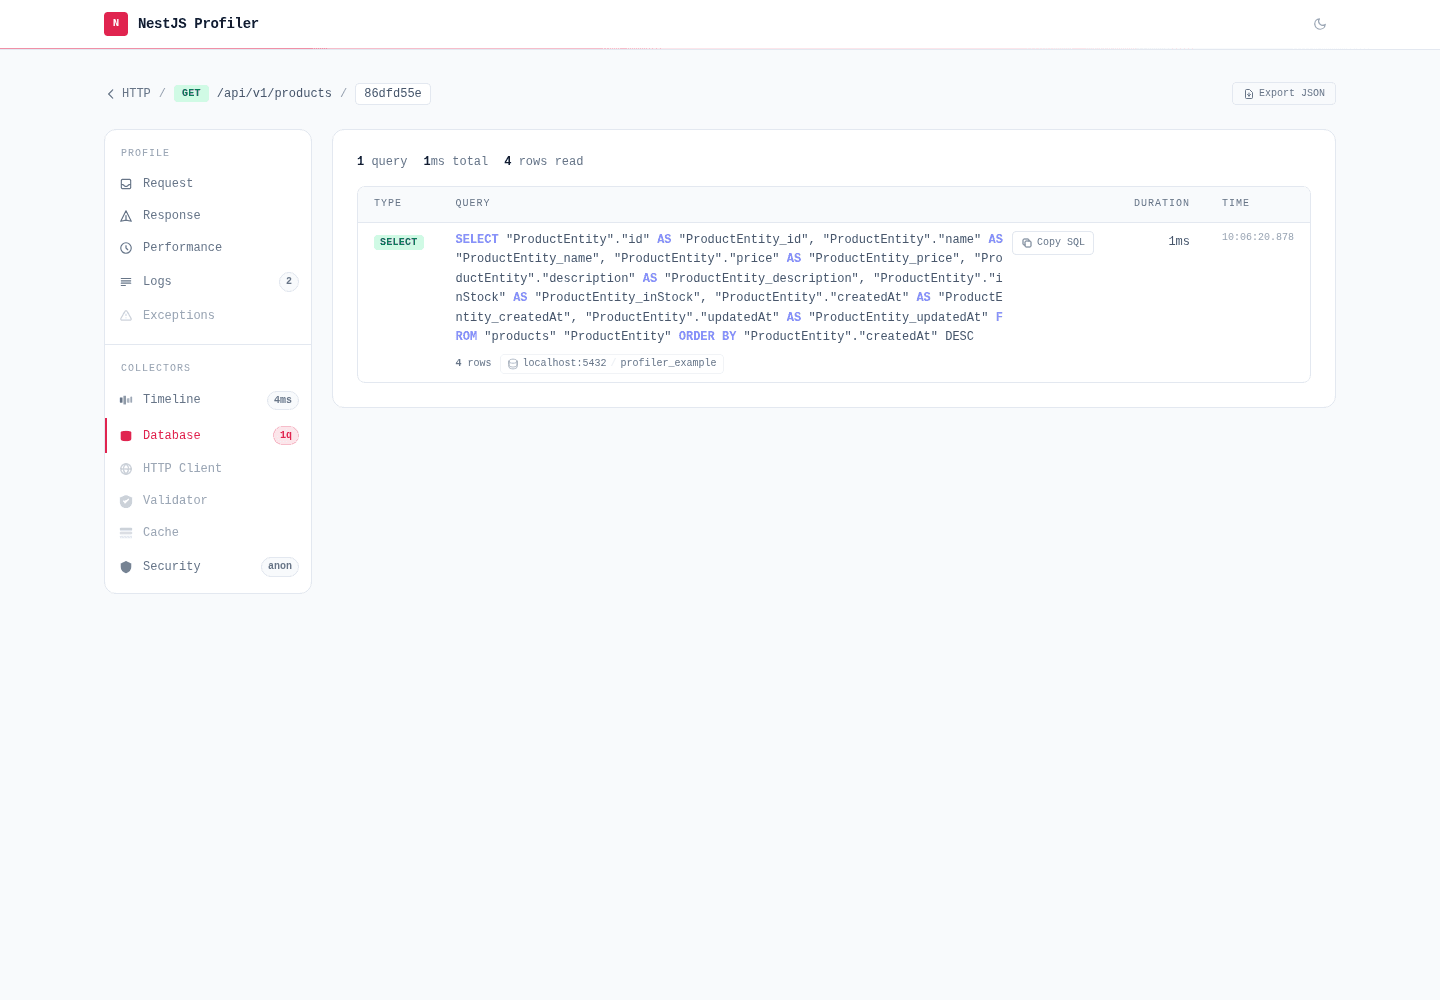
Database
TypeORM and MikroORM SQL queries with type, duration and slow-query highlighting.
MongoDB
Mongoose queries and aggregations with collection, duration and result count.
HTTP Client / GraphQL
Outgoing HttpService calls and GraphQL queries/mutations - method, URL, operation type and name.
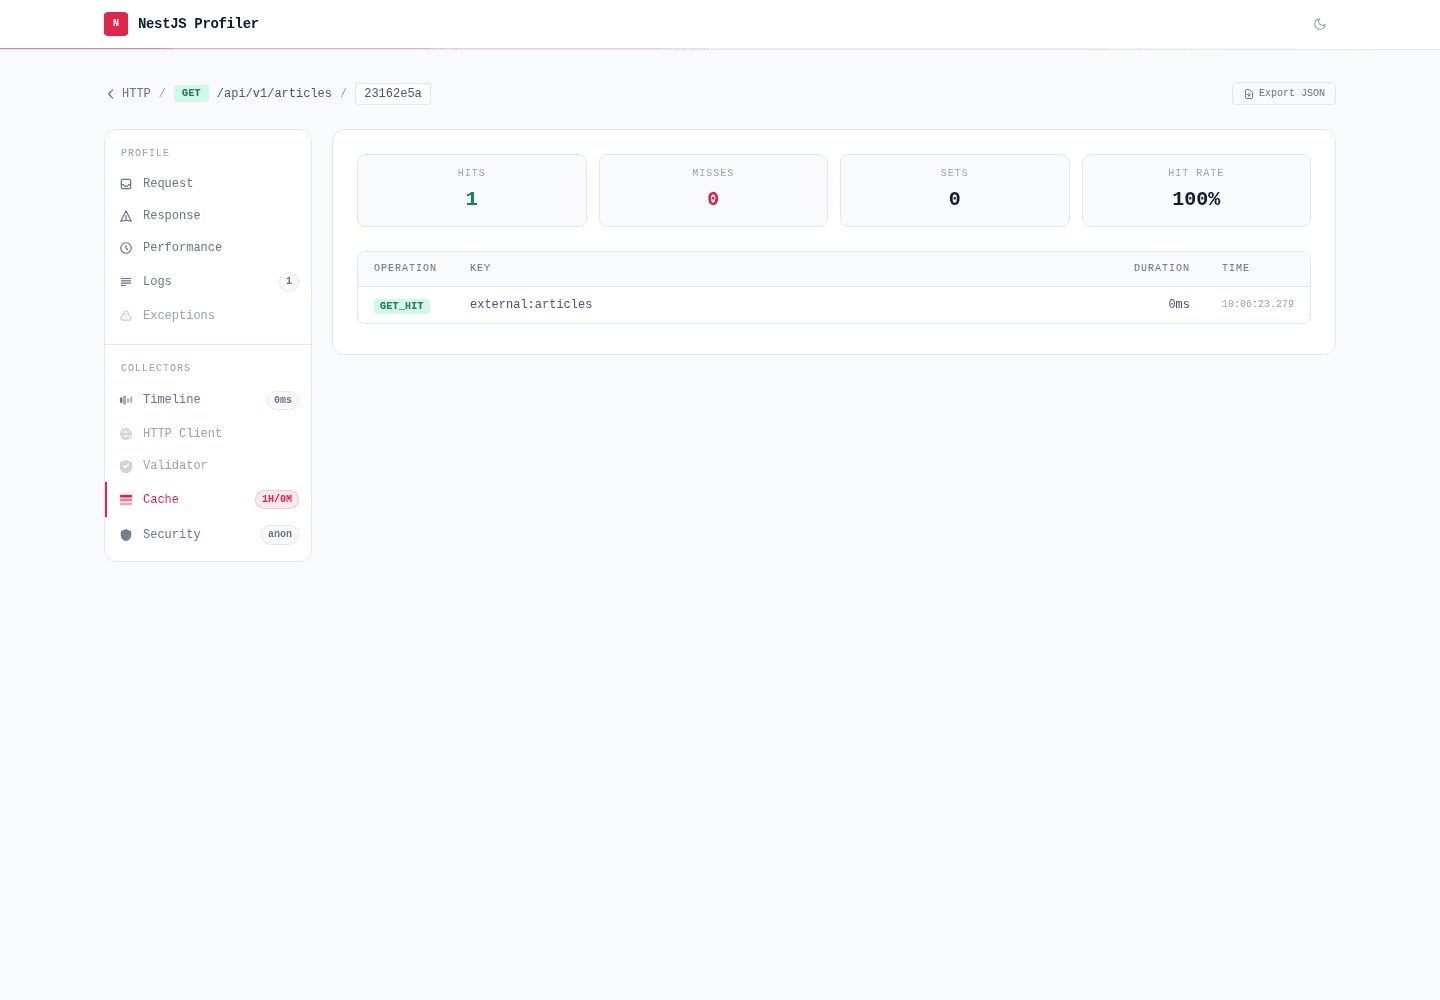
Cache
GET_HIT / GET_MISS / SET / DEL operations with a hit-ratio badge.
Command
nest-commander CLI runs - command name, arguments, options and exit code.
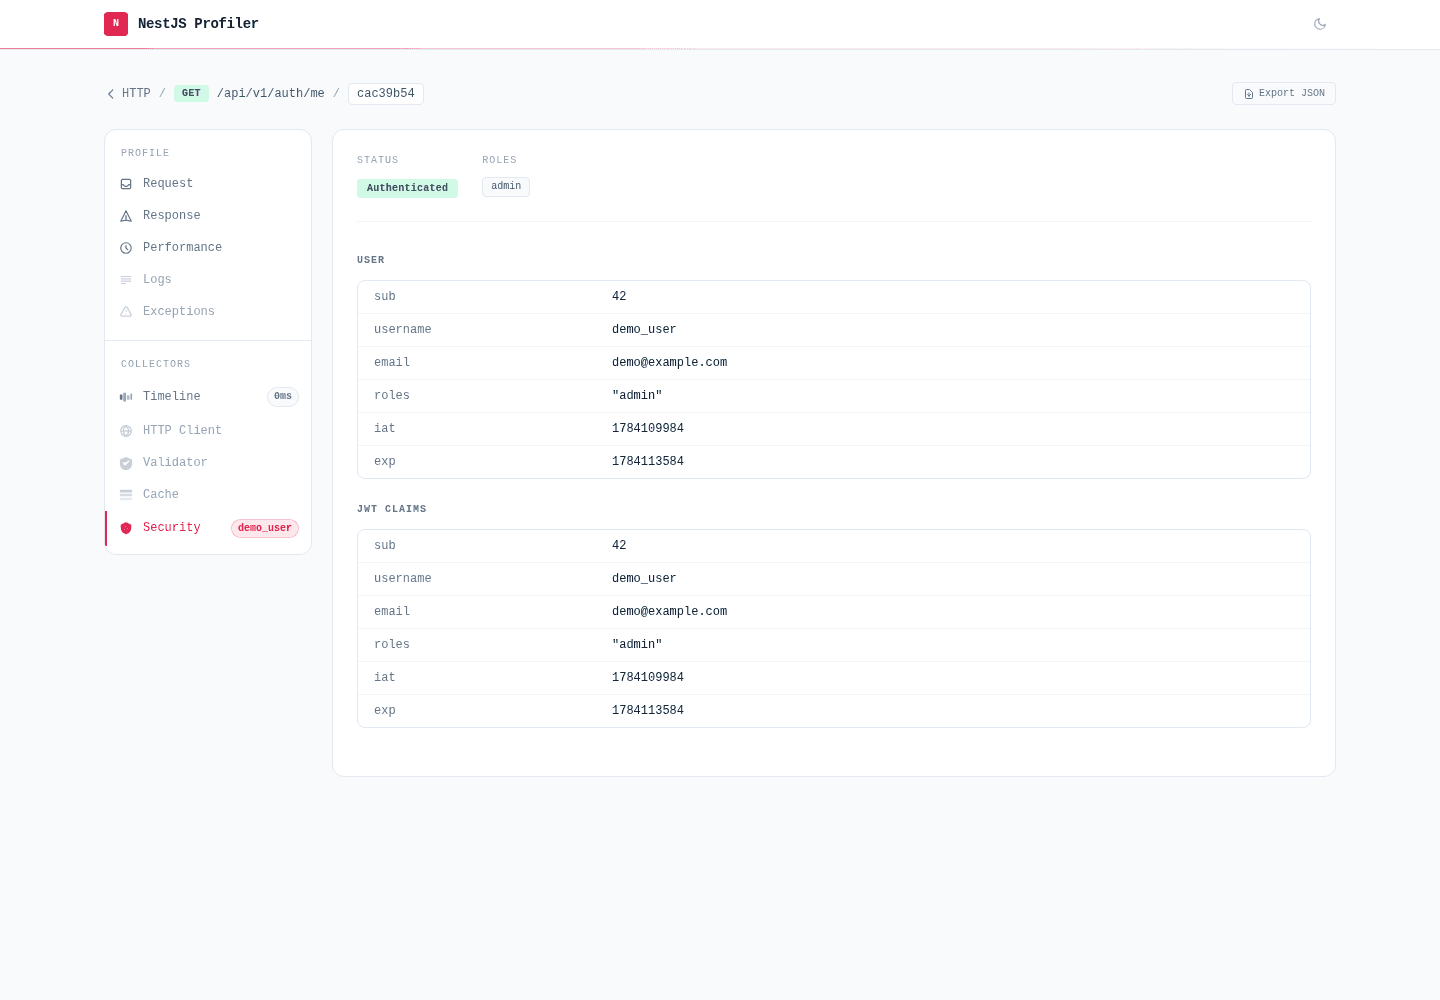
Security
request.user, JWT claims and roles - sensitive fields masked.
Config
ConfigService snapshot, flattened to dot-keys with secret masking.
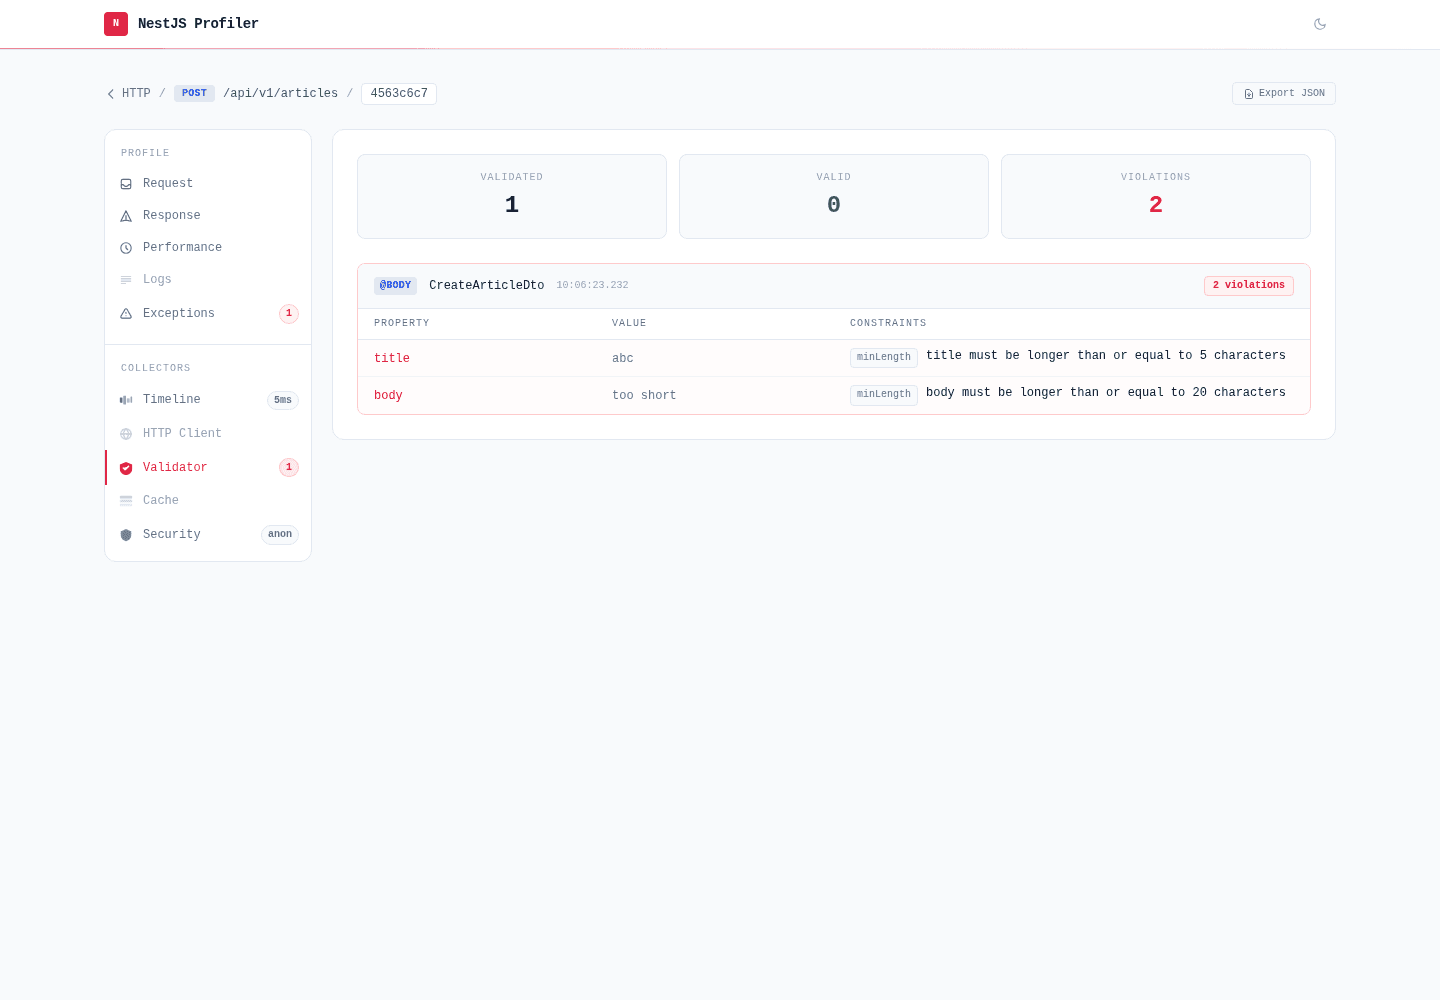
Validator
DTO validation results with per-property constraint violations.
Timeline
Custom spans created with startSpan() rendered as synchronized bars.
Built for everyday debugging
- Extensible collectors - implement IProfilerCollector to add your own panel
- Two storage backends: in-memory LRU or file-based persistence
- Request sampling & path filtering to control overhead
- Module-per-collector pattern - import each package where it belongs
- GraphQL support - Apollo, Mercurius and graphql-yoga via nest-profiler-graphql
- CLI command profiling - nest-commander runs shown next to HTTP requests via nest-profiler-commander
A closer look
Ready to profile your app?
Get the core package running and open the profiler UI in under five minutes.