nest-profiler-typeorm
Profile TypeORM SQL queries in the Database panel.
@eleven-labs/nest-profiler-typeorm
@eleven-labs/nest-profiler-typeorm captures every SQL query executed by TypeORM during a profiled execution and displays them in a dedicated Database panel.

Installation
pnpm add @eleven-labs/nest-profiler-typeorm@alphaThere is no stable release yet — install every
@eleven-labs/nest-profiler*package with the@alphadist-tag (@latestresolves to nothing).
Peer dependencies: typeorm ^1.0.0, @nestjs/typeorm ^11.0.0
Setup
import { ConditionalModule } from '@nestjs/config';
import { TypeOrmModule } from '@nestjs/typeorm';
import { TypeOrmCollectorModule } from '@eleven-labs/nest-profiler-typeorm';
import { DataSource } from 'typeorm';

const isProfilerEnabled = (env: NodeJS.ProcessEnv) => env['PROFILER_ENABLED'] === 'true'

@Module({
  imports: [
    TypeOrmModule.forRoot({ ... }),
    ConditionalModule.registerWhen(
      TypeOrmCollectorModule.forRoot({
        dataSource, // your DataSource instance
        slowThreshold: 100, // ms — queries at/above this are tagged `slow` (default: 100)
        nPlusOneThreshold: 2, // identical queries repeated ≥ N are tagged `n-plus-one` / N+1 (default: 2)
        slowSeverity: 'warning', // severity of the `slow` tag — 'info' | 'warning' | 'danger' (default: warning)
      }),
      isProfilerEnabled,
    ),
  ],
})
export class AppModule {}
Since DataSource is not available at module declaration time, use forRootAsync:
ConditionalModule.registerWhen(
  TypeOrmCollectorModule.forRootAsync({
    inject: [DataSource],
    useFactory: (dataSource: DataSource) => ({ dataSource, slowThreshold: 50 }),
  }),
  isProfilerEnabled,
),
Enabling / disabling — gate the collector with
ConditionalModule.registerWhen(..., isProfilerEnabled)as shown, so it loads only whenPROFILER_ENABLEDis on. Wire the coreProfilerModuleonce at the root — the recommended setup bundles the root-level profiler modules into a singleProfilingModulebehind aConditionalModulegate (see Enabling and disabling the profiler and the example app). A top-levelenabledoption is also supported as an alternative.
What it collects
For each SQL query executed during a request:
| Field | Description |
|---|---|
sql | The SQL query string (with keyword highlighting) |
parameters | Bound parameters |
duration | Execution time in ms |
type | SELECT, INSERT, UPDATE, DELETE, OTHER |
startedAt | Unix timestamp |
error | Error message if the query failed |
streaming | true for streaming reads (QueryBuilder.stream()) |
rowCount | Rows affected (writes) or returned (reads) |
connection | Connection endpoint host:port (no credentials) |
database | Target database name |
fingerprint | Parameter-free normalized SQL, used to group N+1s |
tags | Performance tags applied by the core rule engine |
Slow queries, N+1 patterns and silent zero-row UPDATE/DELETEs (the zero-rows tag) are flagged by the core rule engine and shown as coloured pills in the panel (and filterable on the list page). Configure the thresholds with slowThreshold / nPlusOneThreshold / chattyThreshold, and each tag's severity with slowSeverity / nPlusOneSeverity / chattySeverity / zeroRowsSeverity ('info' | 'warning' | 'danger'); see Performance tags.
Toolbar badge
The toolbar badge shows: {n}q (e.g., 5q). When slow queries are present: 5q (2 slow).
rowCount is best-effort per driver: an array result yields its length; a QueryResult-style object yields its affected / rowCount / affectedRows / changes. A write on a driver that exposes none stays undefined (never a spurious 0), and streamed reads never capture a row count. connection / database are read once from the DataSource options, and connection is omitted for drivers without a host/port (e.g. sqlite).
How it works
The collector patches dataSource.createQueryRunner() at module initialization to wrap every QueryRunner.query() call with timing, recording an entry into the active request profile (resolved via nestjs-cls); TypeOrmCollector.collect() then reads and returns those entries. This captures all queries from repositories, the EntityManager, and raw dataSource.query() calls. Queries executed outside a request context (e.g. during module initialization) are silently ignored. The patch is transparent — TypeORM behavior is unchanged.
Streaming reads — Repository.stream() / QueryBuilder.stream() go through QueryRunner.stream(), a separate path from query(). The collector also wraps stream(): it measures duration across the returned stream's lifetime by listening only to its terminal end/close/error events — never a data listener, so no rows are consumed or diverted from the caller — and records the entry with streaming: true. Streamed row counts are not captured (that would require tapping the data).
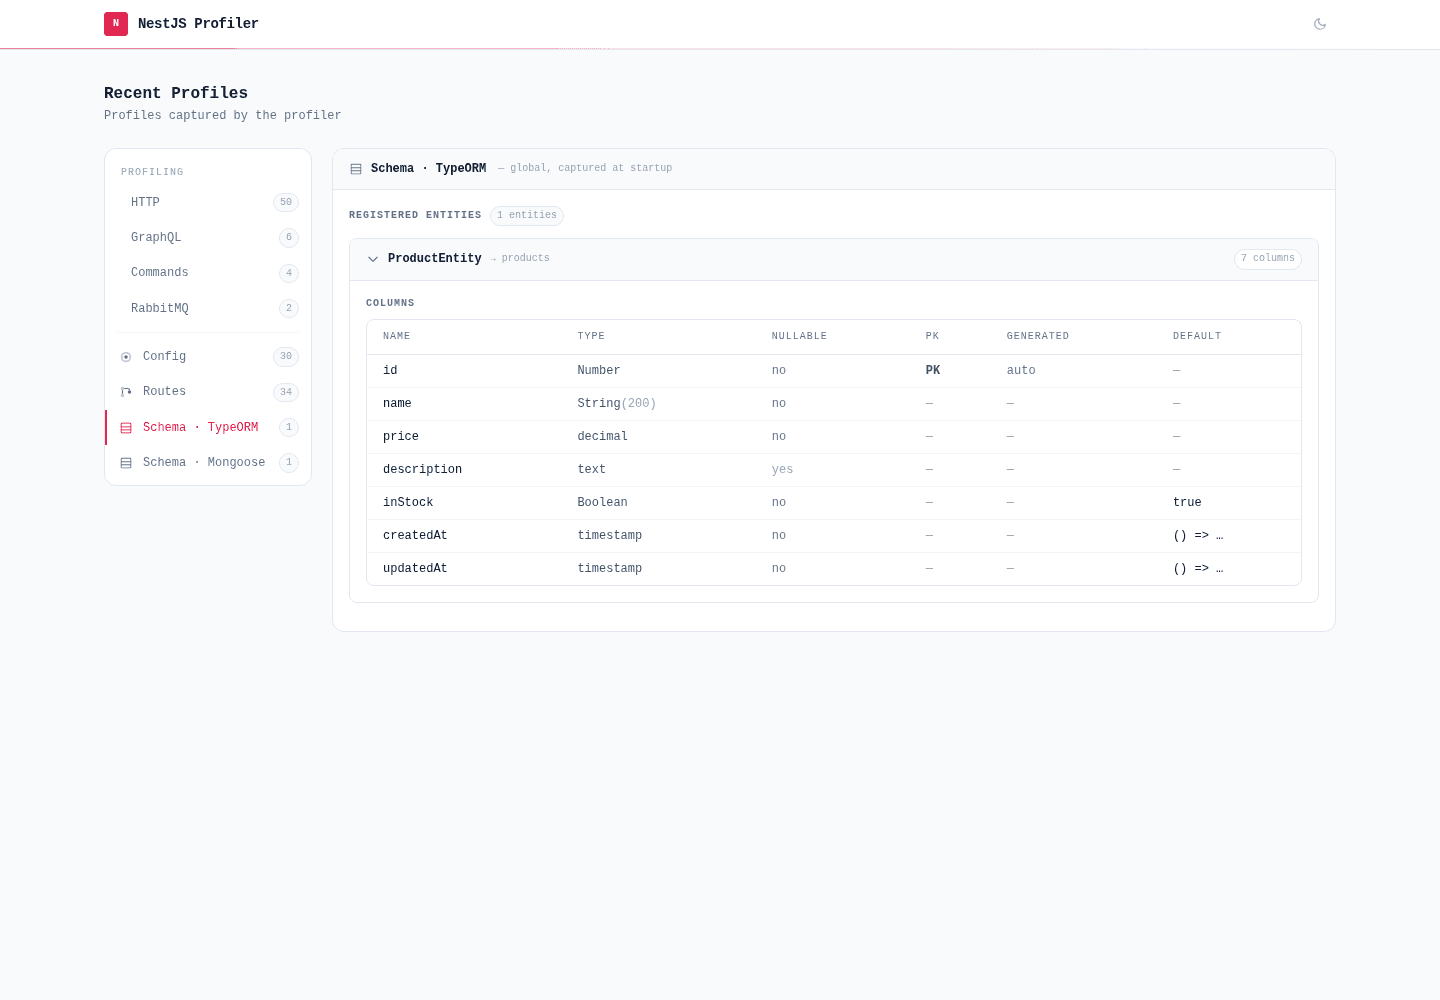
Schema panel
TypeOrmSchemaCollectorModule adds a global Schema · TypeORM panel to the profiler home page, listing every registered entity with its columns (type, nullable, primary key, generated, default), relations (kind → target) and indexes (name, columns, unique). Unlike the per-request Database panel, this is static process-level data introspected once at startup — so it renders on the list page next to the Config panel, not inside a profile.
import { TypeOrmSchemaCollectorModule } from '@eleven-labs/nest-profiler-typeorm';

ConditionalModule.registerWhen(TypeOrmSchemaCollectorModule.forRoot(), isProfilerEnabled),
Pass connectionName to introspect a named DataSource (omit it for the default connection), and enabled: false to disable per environment. The panel reads dataSource.entityMetadatas and never touches data; column defaults are passed through the profiler's redactString, so a default embedding a secret (e.g. a DSN) is masked. The panel no-ops (does not appear) when no DataSource is wired or none is initialized.