Performance tags (N+1, slow, error…)
Detect N+1 queries, slow queries, failed HTTP calls, chatty endpoints, large payloads and silent zero-row writes with the core rule-based tagging engine, and filter profiles by tag.
The profiler runs a single analysis pass once per profile — after every collector, before the profile is persisted — that flags common performance anti-patterns and attaches structured tags to the offending queries and HTTP calls. Tags surface as coloured pills in the panels and on the list page, where a Performance tag filter narrows the profiles down to a given issue.
Detection spans every collector that opts into the engine: the query collectors (typeorm, mikro-orm, mongoose), the outgoing-HTTP collector (http), the event emitter (event) and published RabbitMQ messages (rabbitmq). Grouping is done once in the core on a per-entry fingerprint each collector supplies (normalized SQL, collection + operation + filter shape, or method + normalized URL), so the same query executed with different bind values is recognised as a repeat.
The detail page leads with a Performance banner summarising the issues, and colour-codes the affected collector tab (and its sub-tabs) by severity so a problematic panel stands out at a glance. Below, a GraphQL query that lists products, resolves each product's reviews from MongoDB and then each review's author over HTTP — a classic field-resolver N+1, repeated on both sides — is flagged N+1 ×5:
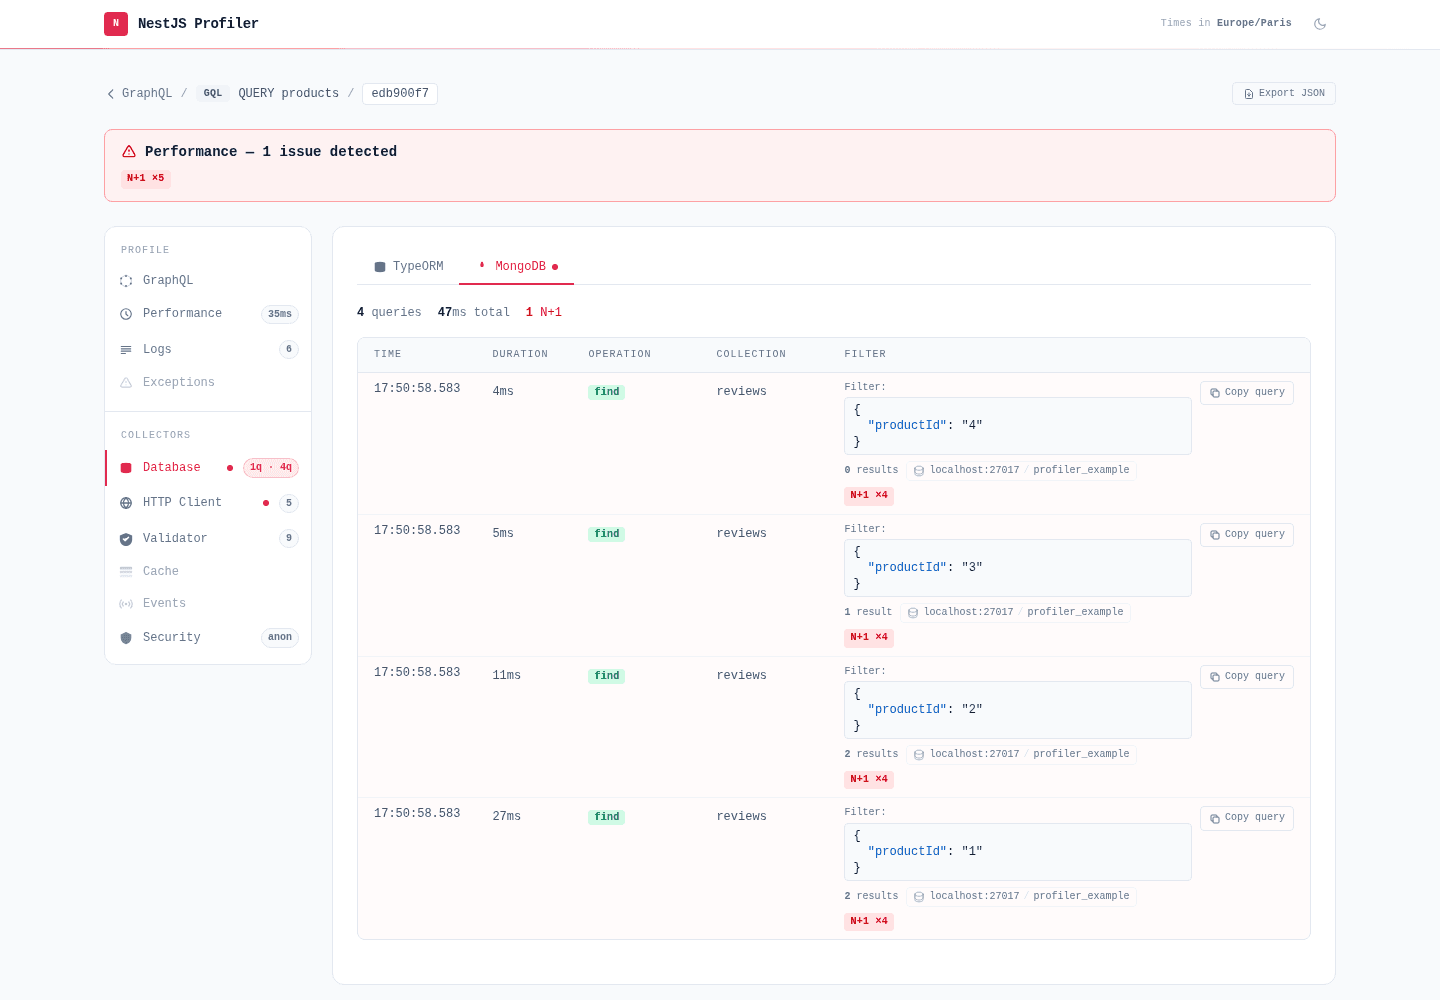
Tags describe a profile, so the fix is verified the same way it was found: batching the same query through request-scoped DataLoaders folds it into one $in query and one bulk HTTP call, and the tag is gone. The example application ships both paths behind a flag for exactly that comparison.
Built-in tags
| Tag | Applies to | When |
|---|---|---|
slow | queries, HTTP | A single call's duration reaches the collector's slowThreshold. |
n-plus-one | queries, HTTP | The same fingerprint runs nPlusOneThreshold+ times — the N+1 anti-pattern (repeated queries or repeated HTTP calls); the pill reads N+1 ×N. |
error | queries, HTTP, profile | A call failed (it threw, or answered ≥ 500), or the profile itself failed per its kind's definition. Unlike the tags around it, "failure" has no universal meaning, so it is defined per package — see What counts as an error. |
chatty | profile | A single request made a lot of calls to one backend — chattyThreshold+ SQL/Mongo queries or outgoing HTTP calls (default 20 queries, 10 HTTP). Unlike N+1, the calls need not be identical: it catches an endpoint that is "chatty" overall (many small round-trips), often a sign of missing batching or eager-loading. |
large-payload | HTTP | A request/response payload reaches largePayloadThreshold. |
zero-rows | queries | A write changed nothing — a SQL UPDATE/DELETE with rowCount === 0, or a Mongoose delete/update with count === 0. A silent failure (typically a mismatched WHERE / filter). Empty reads and writes whose row count could not be captured are never flagged. |
Each tag is a ProfilerTag — { id, label, severity, count?, detail? } — attached to the entry and aggregated (deduplicated) onto profile.tags.
Thresholds
Thresholds live on each collector, so a Mongo slow query and a slow HTTP call can differ. Defaults:
| Option | typeorm / mikro-orm / mongoose | http | event-emitter | rabbitmq (publish) |
|---|---|---|---|---|
slowThreshold (ms) | 100 | 300 | 100 | 50 |
nPlusOneThreshold | 2 | 2 | 2 | 2 |
chattyThreshold | 20 | 10 | 20 | 10 |
largePayloadThreshold | — | 1 MB | — | — |
TypeOrmCollectorModule.forRoot({ slowThreshold: 50, nPlusOneThreshold: 2 });
HttpCollectorModule.forRoot({ slowThreshold: 500, largePayloadThreshold: 512 * 1024 });
Configuring severity
Each tag carries a severity ('info' | 'warning' | 'danger') that drives its colour everywhere in the UI — the pill, the duration text, the summary counts, the row highlight and the Performance banner. Every threshold-based tag's severity is configurable per collector, as a flat option next to its threshold:
| Option | Applies to | Default |
|---|---|---|
slowSeverity | queries, http | warning |
nPlusOneSeverity | queries, http | danger |
chattySeverity | queries, http | warning |
largePayloadSeverity | http | warning |
zeroRowsSeverity | typeorm / mikro-orm / mongoose | warning |
// Treat a slow query as a hard failure in this app — the pill, duration, count and banner all turn red.
TypeOrmCollectorModule.forRoot({ slowThreshold: 50, slowSeverity: 'danger' });
The error tag is danger by default and is configurable like the others, but through its own option — what earns it is not a duration threshold but a definition of failure, which each package owns: ProfilerModule.forRoot({ error: { severity: 'warning' } }). See What counts as an error. A custom rule sets its own severity directly on the tag it emits (see below).
Filtering by tag
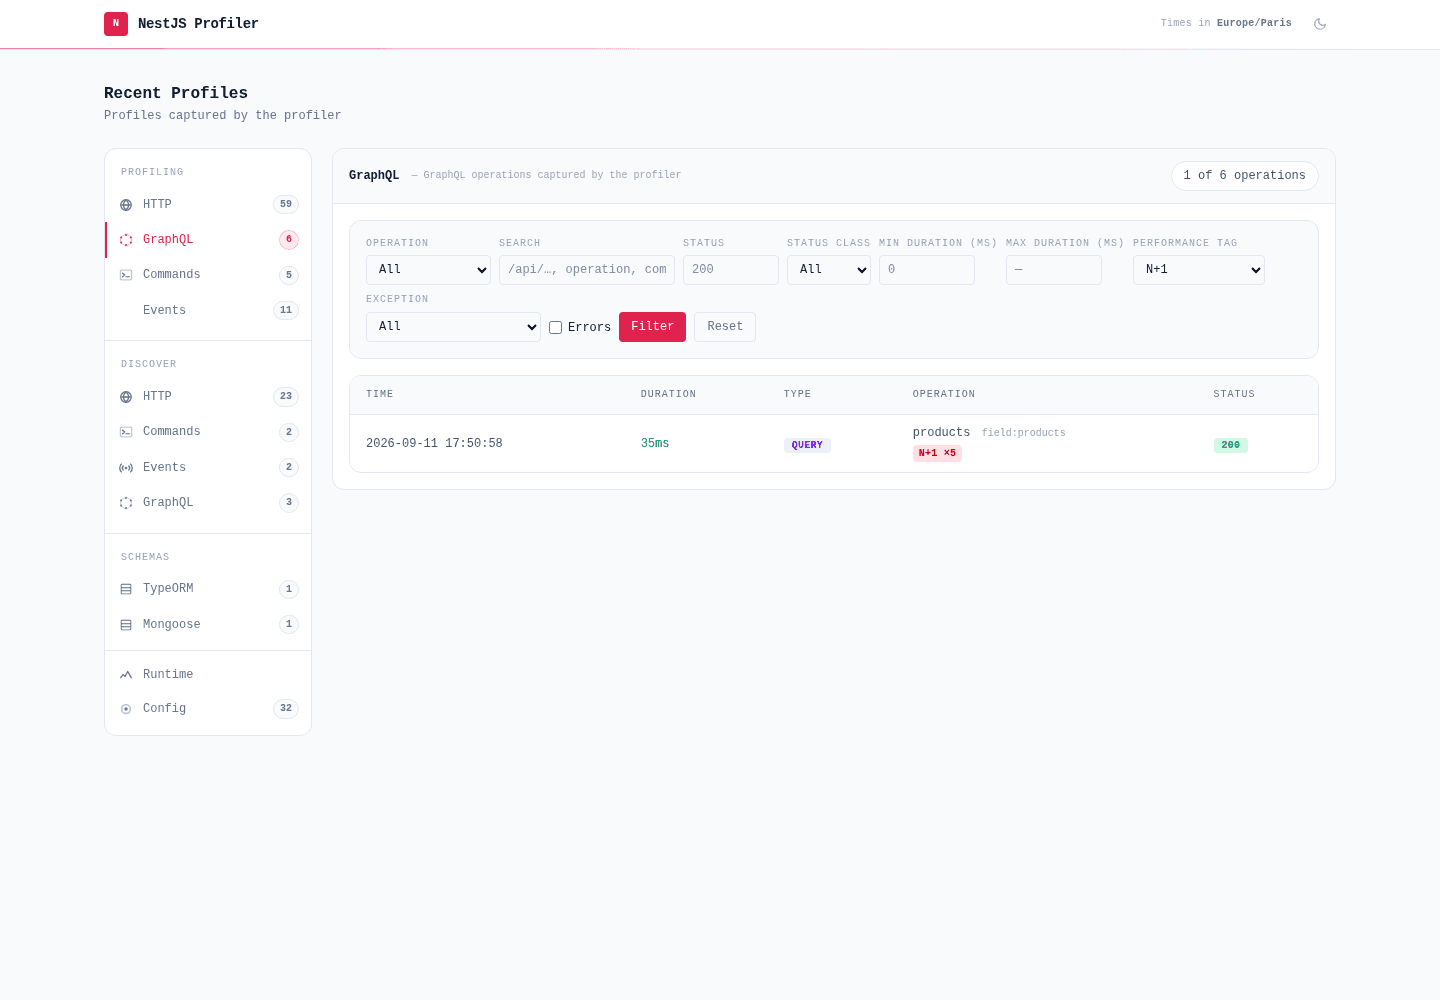
The list page shows a Performance tag select (Slow / N+1 / Chatty / Large payload / No rows) that keeps only the profiles carrying that tag, with the tag pills rendered inline on each row. Failures are not performance issues, so the error tag has its own Errors checkbox, alongside an Exception select that narrows to one failure type — see What counts as an error.
Custom rules
A rule inspects the collected entries and tags whatever it wants. Register one declaratively or programmatically:
import { PerformanceRule } from '@eleven-labs/nest-profiler';

const seqScanRule: PerformanceRule = {
  id: 'seq-scan',
  evaluate(ctx) {
    for (const { entries, domain } of ctx.collectors) {
      if (domain !== 'query') continue;
      for (const entry of entries) {
        if (/seq scan/i.test((entry as { sql?: string }).sql ?? '')) {
          ctx.tagEntry(entry, { id: 'seq-scan', label: 'Seq scan', severity: 'warning' });
        }
      }
    }
  },
};

ProfilerModule.forRoot({ performance: { rules: [seqScanRule] } });
// …or, from a module's onModuleInit: core.registerPerformanceRule(seqScanRule);
A rule's ctx.collectors entries carry duration, fingerprint and the concrete collector fields (cast by domain); call ctx.tagEntry(entry, tag) or ctx.tagProfile(tag). The emitted tag id becomes filterable — offer it in the list select with core.registerFilterOption('tag', { value: 'seq-scan', label: 'Seq scan' }).
Trace & custom collectors
Capture trace spans with TracerService.span() and add your own data panel to every profile with the @ProfilerCollector() decorator.
What counts as an error
Define what a failure means for each entrypoint kind — HTTP status codes, GraphQL error codes, message handlers, command outcomes — and drive the error tag and the Errors filter from your own definition.