SQL query profiling (TypeORM & MikroORM)
Capture every SQL query issued by TypeORM or MikroORM and inspect duration, slow queries and execution plans in the profiler's Database panel.
This tutorial shows how to profile the SQL queries of a NestJS application backed by PostgreSQL, whether it uses TypeORM (@nestjs/typeorm) or MikroORM (@mikro-orm/nestjs). There is one collector package per ORM, but they share the same Database panel rendering and the same QueryEntry shape (provided by the core AbstractSqlQueryCollector), so everything below the wiring is identical whichever one you use — pick your ORM in each step.
Prerequisites
@eleven-labs/nest-profilerinstalled and configured- TypeORM —
@nestjs/typeormandtypeorminstalled with a workingDataSource, or - MikroORM —
@mikro-orm/core,@mikro-orm/nestjsand a driver (e.g.@mikro-orm/postgresql) installed with a workingMikroOrmModule.forRoot()
Step 1 - Install the package
# TypeORM
pnpm add @eleven-labs/nest-profiler-typeorm

# MikroORM
pnpm add @eleven-labs/nest-profiler-mikro-orm
Step 2 - Register the collector
Add the collector module after the ORM module in your root module:
import { TypeOrmModule } from '@nestjs/typeorm';
import { ConditionalModule } from '@nestjs/config';
import { ProfilerModule } from '@eleven-labs/nest-profiler';
import { TypeOrmCollectorModule } from '@eleven-labs/nest-profiler-typeorm';

const isProfilerEnabled = (env: NodeJS.ProcessEnv) => env['PROFILER_ENABLED'] === 'true';

@Module({
  imports: [
    TypeOrmModule.forRootAsync({ ... }),
    ConditionalModule.registerWhen(ProfilerModule.forRoot({ isGlobal: true }), isProfilerEnabled),
    ConditionalModule.registerWhen(
      TypeOrmCollectorModule.forRoot({ slowThreshold: 100 }), // queries > 100ms highlighted
      isProfilerEnabled,
    ),
  ],
})
export class AppModule {}import { MikroOrmModule } from '@mikro-orm/nestjs';
import { ConditionalModule } from '@nestjs/config';
import { PostgreSqlDriver } from '@mikro-orm/postgresql';
import { ProfilerModule } from '@eleven-labs/nest-profiler';
import { MikroOrmCollectorModule } from '@eleven-labs/nest-profiler-mikro-orm';
const isProfilerEnabled = (env: NodeJS.ProcessEnv) => env['PROFILER_ENABLED'] === 'true';
@Module({
imports: [
MikroOrmModule.forRoot({ driver: PostgreSqlDriver /* ... */ }),
ConditionalModule.registerWhen(ProfilerModule.forRoot({ isGlobal: true }), isProfilerEnabled),
ConditionalModule.registerWhen(
MikroOrmCollectorModule.forRoot({ slowThreshold: 100 }), // queries > 100ms highlighted
isProfilerEnabled,
),
],
})
export class AppModule {}No other configuration is needed: the TypeORM collector injects the DataSource automatically via @InjectDataSource(), and the MikroORM one wraps the ORM logger automatically and requires no debug flag.
Step 3 - Instrument your services with spans
Wrap your repository calls in span() so the Performance tab's execution trace labels them, and so the SQL queries they issue are nested underneath rather than listed flat against the request:
import { TracerService } from '@eleven-labs/nest-profiler';

@Injectable()
export class ProductsService {
  constructor(
    @InjectRepository(Product) private readonly repo: Repository<Product>,
    private readonly tracer: TracerService,
  ) {}

  async findAll(): Promise<Product[]> {
    return this.tracer.span('db.products.findAll', () =>
      this.repo.find({ order: { createdAt: 'DESC' } }),
    );
  }
}import { TracerService } from '@eleven-labs/nest-profiler';
import { EntityManager } from '@mikro-orm/core';
@Injectable()
export class ProductsService {
constructor(
private readonly em: EntityManager,
private readonly tracer: TracerService,
) {}
async findAll(): Promise<Product[]> {
return this.tracer.span('db.products.findAll', () =>
this.em.fork().find(Product, {}, { orderBy: { createdAt: 'DESC' } }),
);
}
}Step 4 - Test it
Start your application and make a request that triggers a database query:
curl -i http://localhost:3000/api/v1/productsCopy the X-Debug-Token from the response headers, open /_profiler/{token}, and click the Database tab.
You will see:
- Each SQL query with its type badge (
SELECT,INSERT, …) - Duration per query with a bar chart indicator (MikroORM reports its own measured
took) - Slow queries and N+1 patterns flagged as performance tags
- Bound parameters
The Execution Trace shows the db.products.findAll span with the SQL it issued nested underneath it.
Driving options from ConfigService
Use forRootAsync() to resolve the options from ConfigService (or any provider), gated per environment with ConditionalModule — the recommended way (for the enabled flag, see Enabling and disabling the profiler):
import { ConditionalModule, ConfigService } from '@nestjs/config';

ConditionalModule.registerWhen(
  // …or MikroOrmCollectorModule.forRootAsync, same options
  TypeOrmCollectorModule.forRootAsync({
    inject: [ConfigService],
    useFactory: (config: ConfigService) => ({
      slowThreshold: config.get<number>('PROFILER_SLOW_QUERY_MS') ?? 50,
    }),
  }),
  isProfilerEnabled,
);
How it works
The TypeORM collector patches createQueryRunner() to time every query and record it into the active request profile. The MikroORM one wraps Logger.logQuery at module initialization to do the same. Both capture streaming reads (QueryBuilder.stream()) and flag them streaming — with MikroORM these carry duration: 0, a documented limitation. See the full mechanism and the exact set of captured queries on the package pages: TypeORM · MikroORM.
Synchronize in production
Never use synchronize: true (TypeORM) or an auto-updating schema (MikroORM) in production. It
auto-migrates the schema on startup and can cause data loss. Use migrations instead.
Explain slow queries
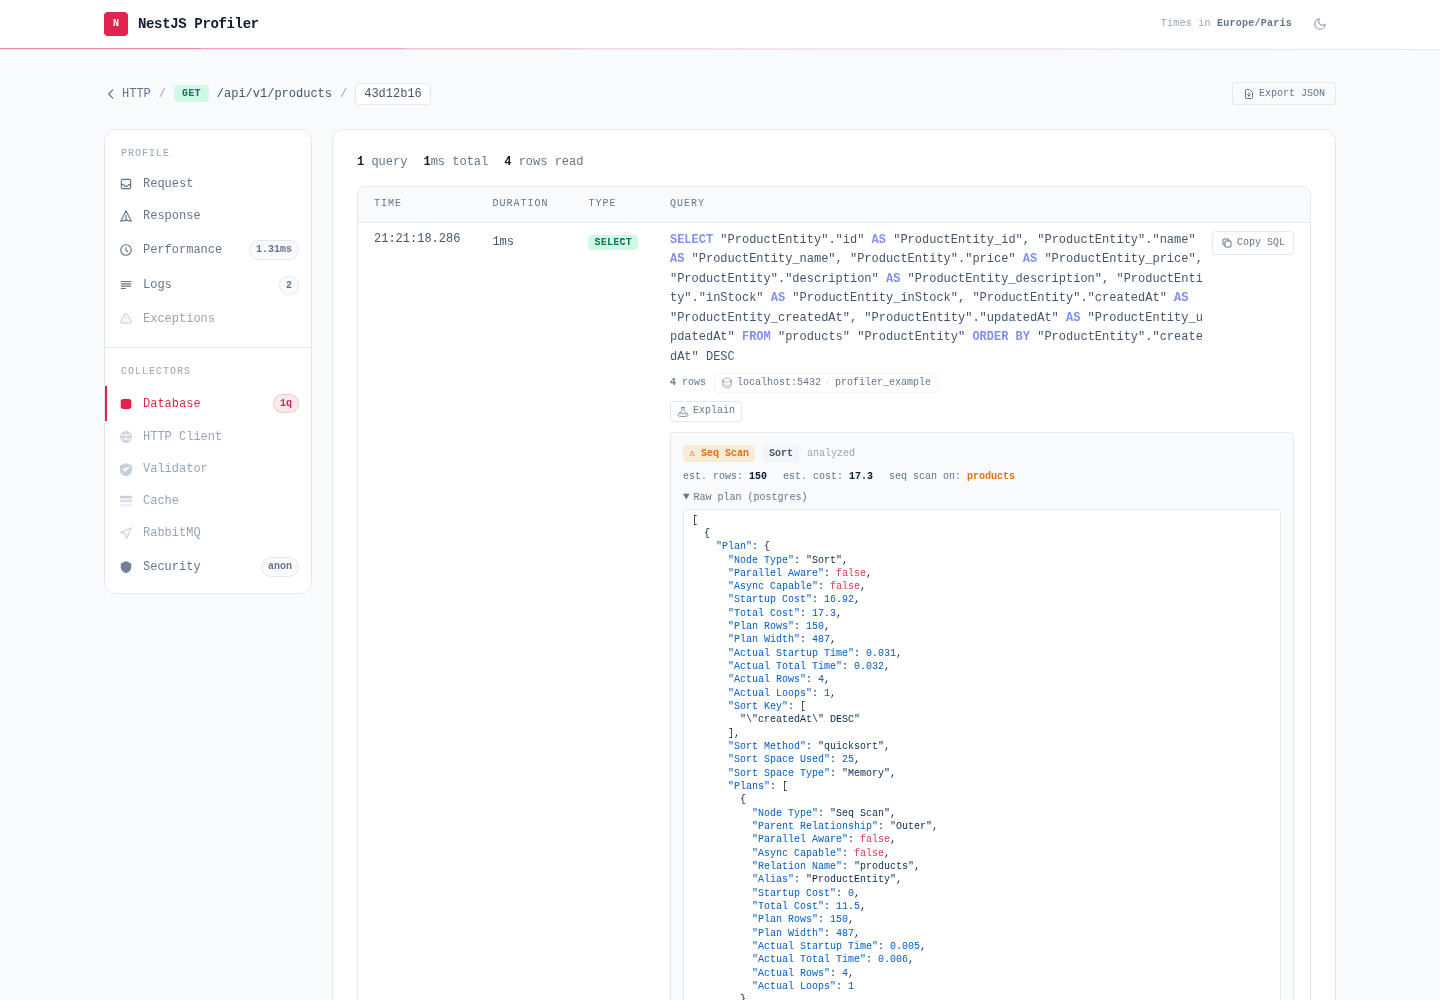
Each query in the Database panel has an Explain button. Click it and the profiler runs EXPLAIN for that one query over your ORM's connection and renders the execution plan inline — the top plan node, a ⚠ warning when it does a full-table (sequential) scan, the scanned relations, estimated rows/cost, and the raw plan. Supported dialects: PostgreSQL, MySQL/MariaDB and SQLite.
It runs on demand only — nothing happens until you click, so the profiled request is never slowed. EXPLAIN alone does not execute the statement; the opt-in analyze variant (EXPLAIN ANALYZE) does run the query and is therefore restricted to SELECT.
TypeOrmCollectorModule.forRoot({
  // …or MikroOrmCollectorModule.forRoot, same options
  explain: { enabled: true }, // default; set `enabled: false` to hide the button
  // explain: { analyze: true }, // dev only — runs the query to measure real timings (SELECT only)
});
Runs against your database
The captured SQL and its parameters are replayed on the live connection when you click, so the
action sits behind the profiler's security. Values that looked like credentials were redacted at
capture, so a plan for such a query may differ slightly from production.
Inspect the schema
Alongside the per-request Database panel, each package ships a schema collector — TypeOrmSchemaCollectorModule / MikroOrmSchemaCollectorModule — a global collector that adds a Schemas / TypeORM (resp. Schemas / MikroORM) view to the profiler home page. It introspects the DataSource or the ORM metadata once at startup and lists every registered entity with its columns, relations and indexes, so you can recall an entity's shape without leaving the profiler.
Register it next to the query collector, gated the same way:
import { TypeOrmSchemaCollectorModule } from '@eleven-labs/nest-profiler-typeorm';
// …or import { MikroOrmSchemaCollectorModule } from '@eleven-labs/nest-profiler-mikro-orm';

ConditionalModule.registerWhen(TypeOrmSchemaCollectorModule.forRoot(), isProfilerEnabled),
Open /_profiler and select the view:
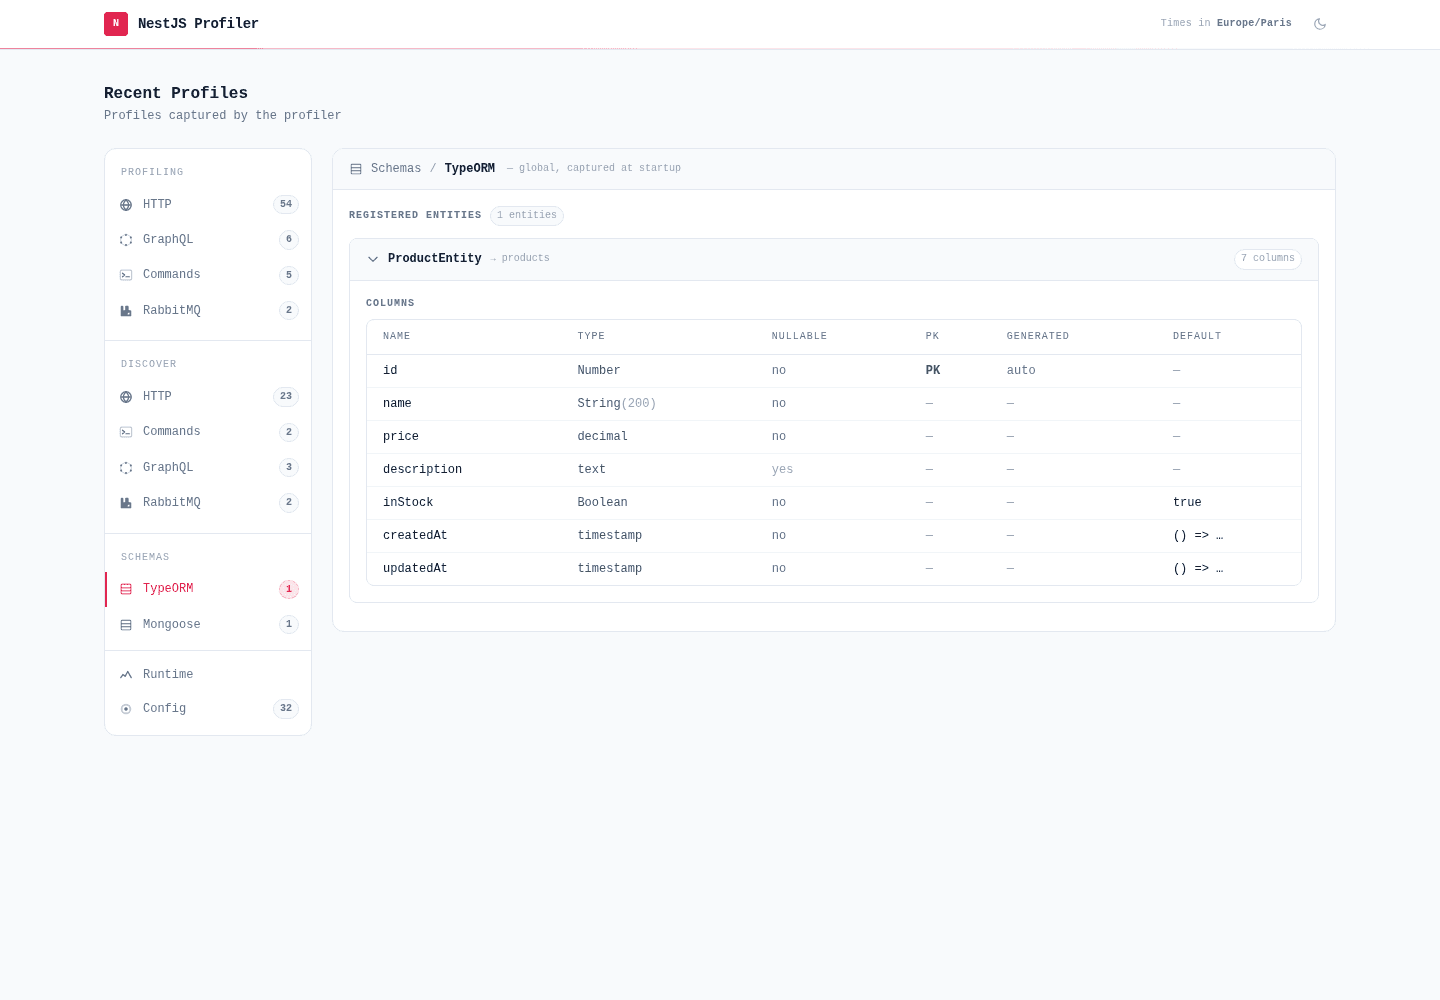
The panel is introspection-only (it never touches data), honours a connectionName option for named DataSources/contexts, redacts secrets embedded in column defaults, and simply does not appear when no DataSource or MikroORM context is wired.